Breast Cancer Analysis

I have versatile skills. I can write code in Python, SQL, HTML, CSS, JavaScript, and Python. Also good in data visualization tools like Pandas, Seaborn, Plotly, Matplotlib, Tableau, and PowerBI. Working with machine learning and also using the following databases: Microsoft SQL Server, PostgreSQL, and having experience in AWS and Azure Cloud Technology. Constant learning new skills every day


Creation of Autonomous Database and Storage-Bucket

Creation of Docker container, creation of database in OCI and then execution
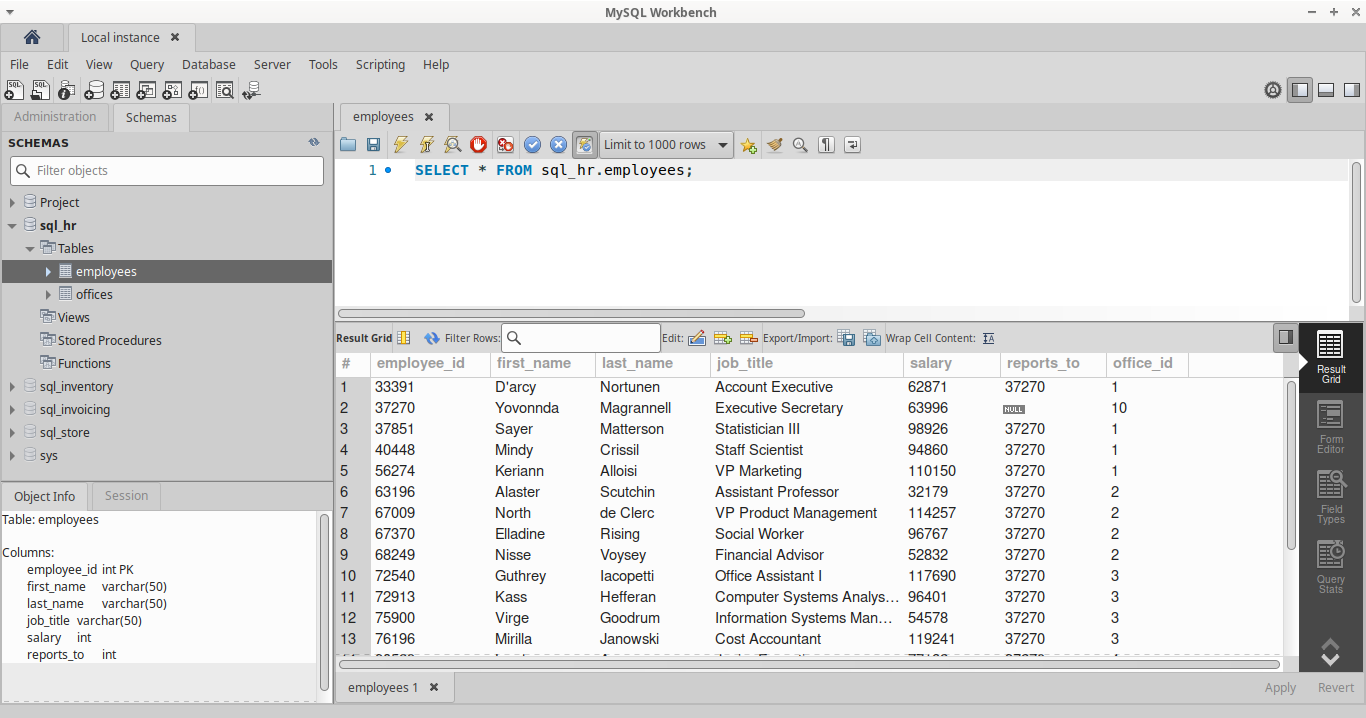
In this project, I used MySQL to perform the task. I created a database call sql_store, sql_hr,
sql_inventory, and sql_invoicing.
Also, create tables from the data supplied then answer
the questions.
In this project, company data was analysed and some business questions were answered by writing the SQL query.
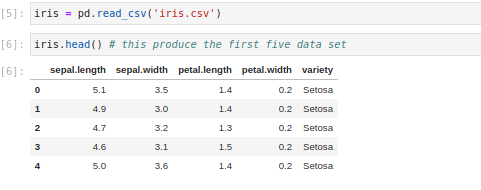
In this project I used Pandas to analysis iris dataset.
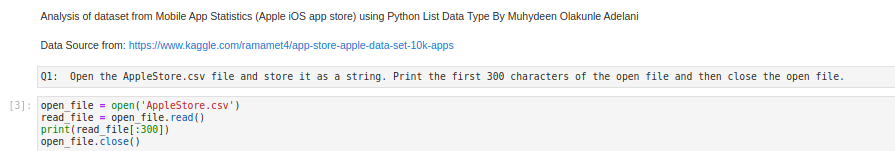
In this project I used Python to read in a large dataset as a list of lists and for loops to analyze a large dataset
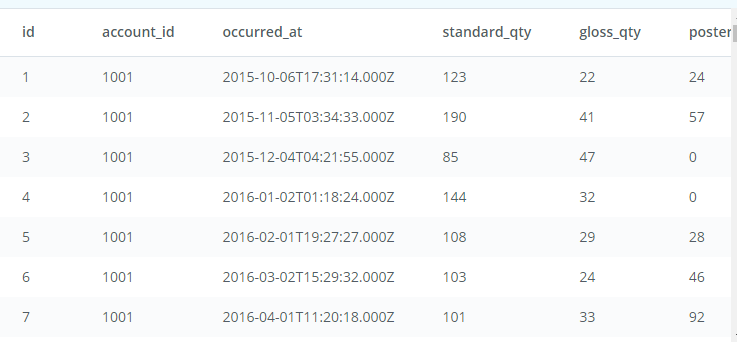
In this project I used Seaborn to visualize sales data by mean of scatter and line plots
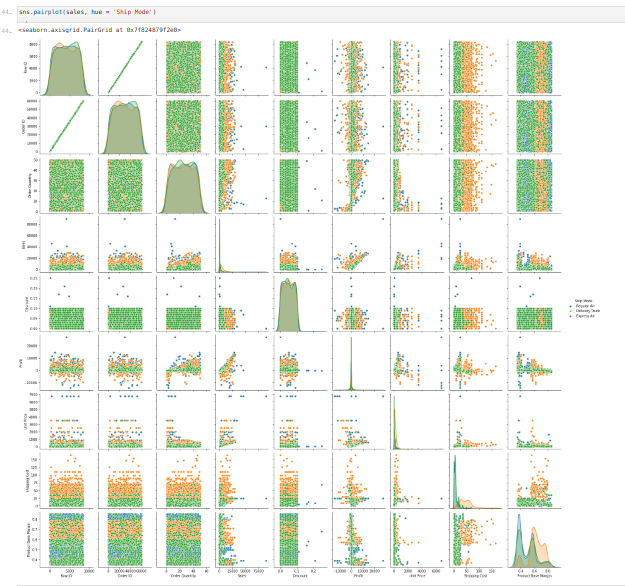
In this project I used Seaborn pair and joint plot functions with NumPy to analyze the sales data
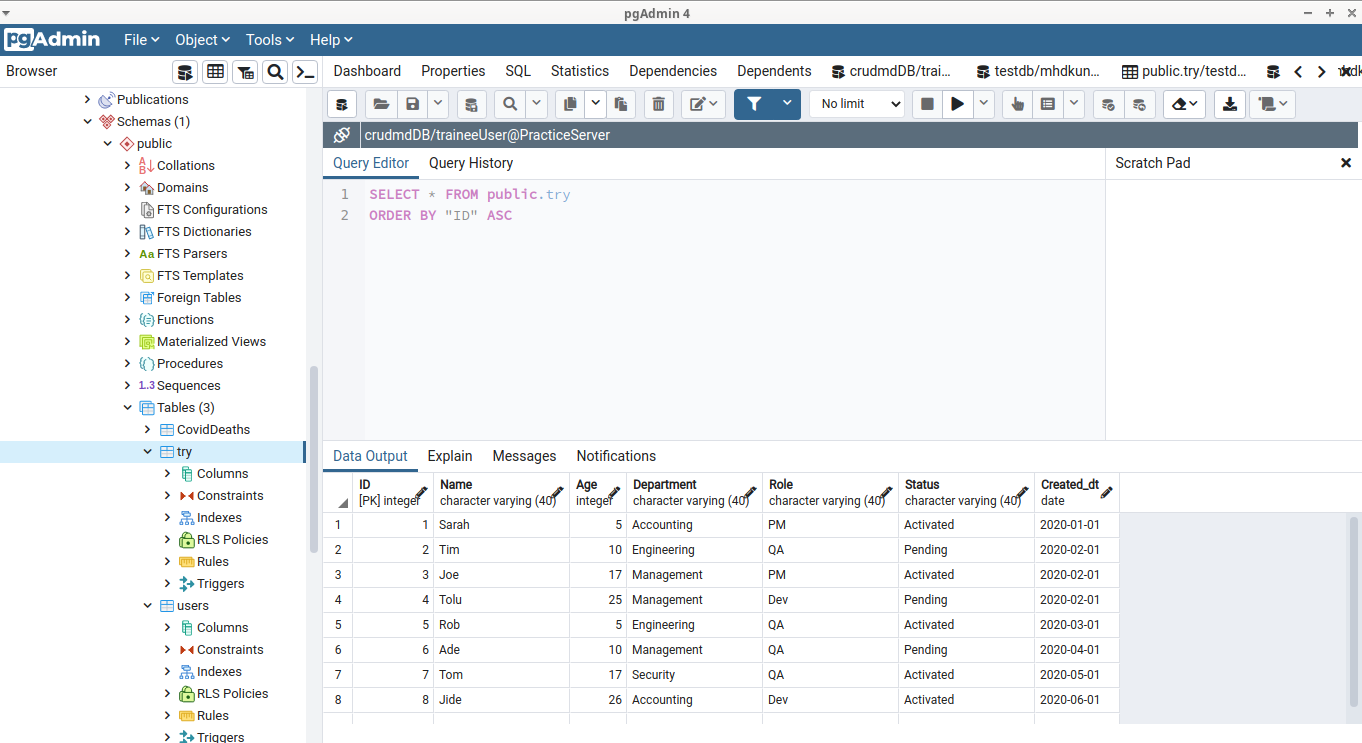
In this project, I answered some interesting questions related to the users in each table column.
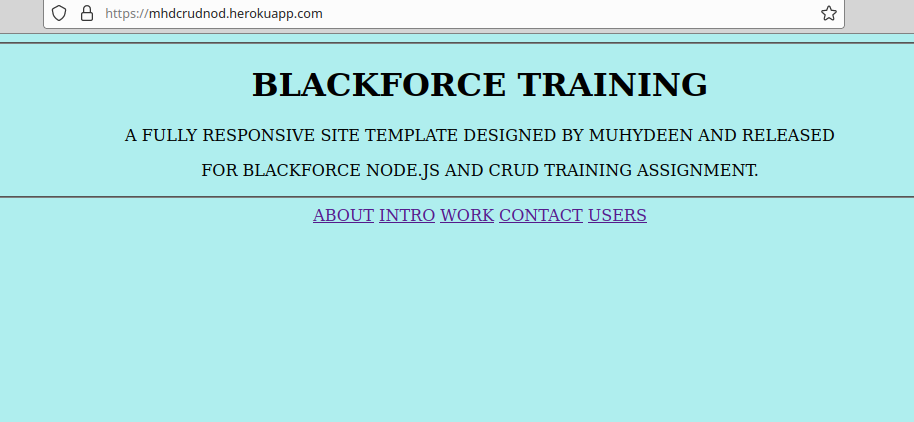
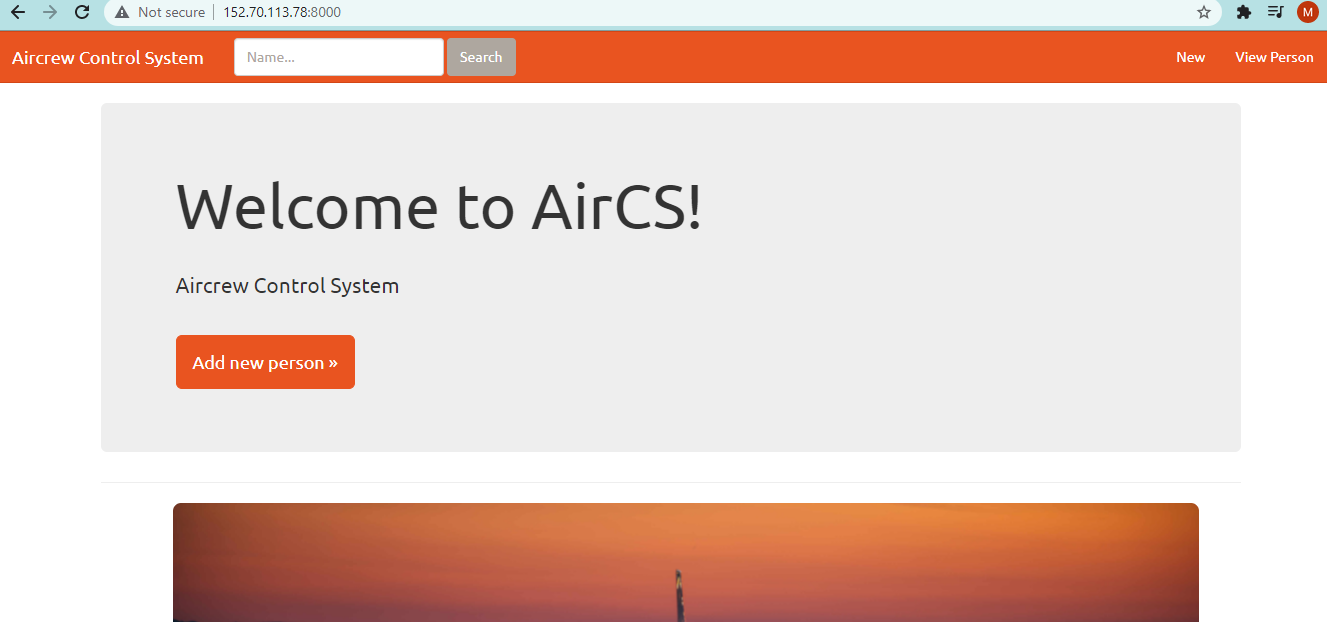
In this project simple CRUD application was created.
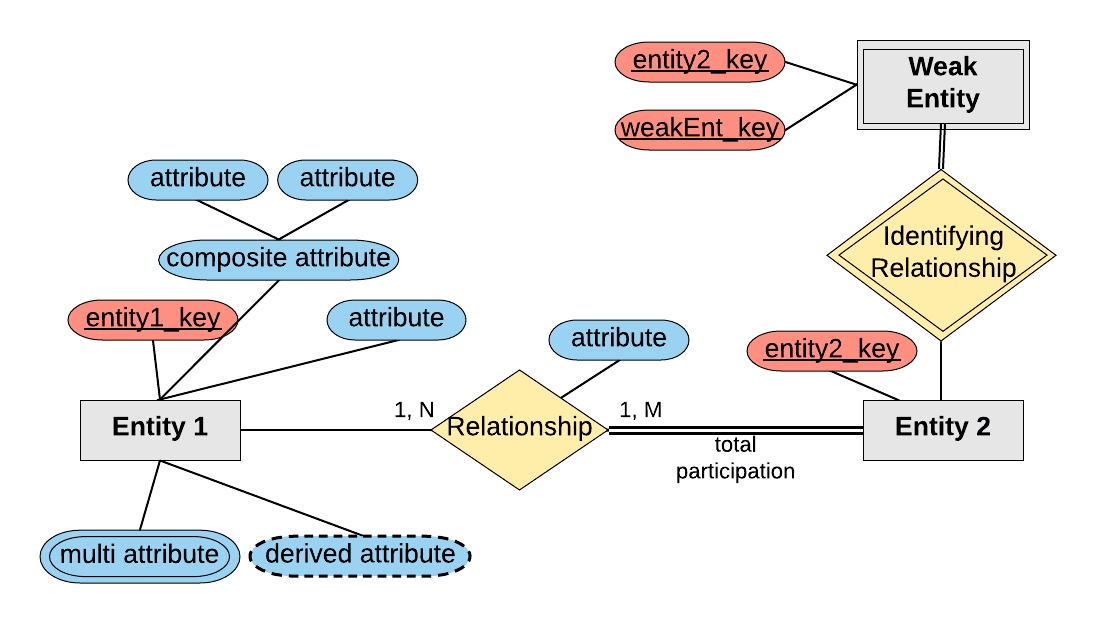
From the ER diagram, tables were created for further assessment.

Covid 19 data was analyzed, and the source is from https://ourworldindata.org/covid-deaths
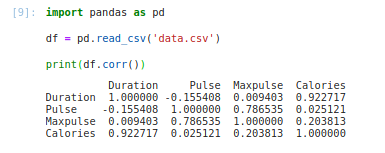
In this project I used Pandas for the analysis
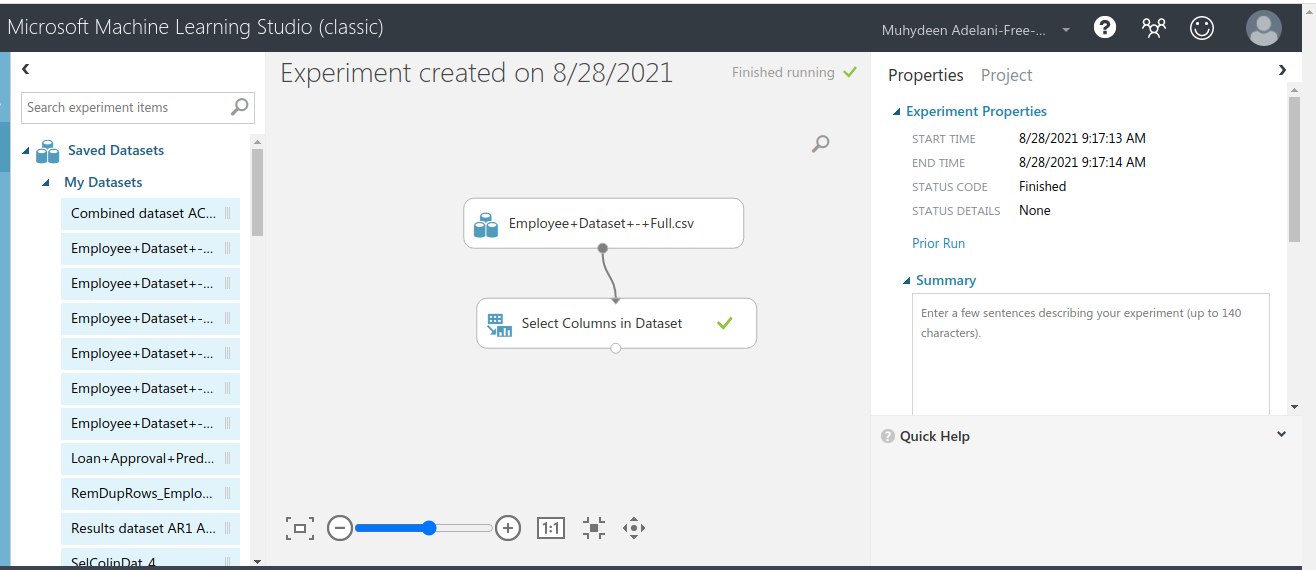
Image of work done with azure machine learning; the result will not be shown for private purposes.
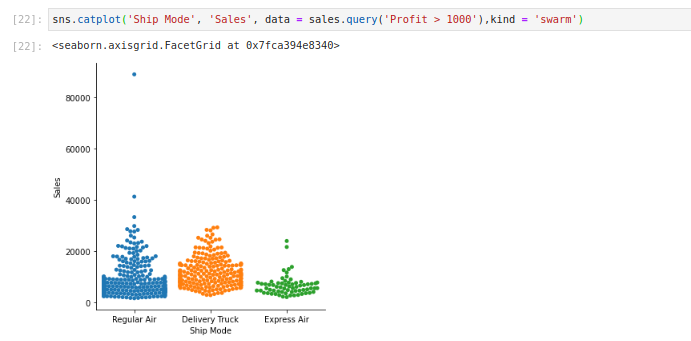
Explore further capability of Seaborn by plotting multiple chart, swarm, box, violin, bar and point plots.